The 2021-2023 NFT Retrospective - Chapter 2: Trapped in a Casino
Chapter 2/4 in a deep analysis of the '21-'23 NFT cycle and what we can learn for the future
Preface
I started this work almost 8 months ago to analyze and come to terms with the rollercoaster of ‘21-’23 for NFTs. I published two longform Twitter threads that covered some of the analysis in this document.
I had assumed that a large number of projects would start to lose steam and being able to assess what narratives had failed as well as what the future might entail would be timely alongside that. Well, after 8 months of waiting, we have finally gotten through the slow decline of ‘21 era NFTs.
The decline in confidence in BAYC (standard bearer for the ‘21 cycle) together with other recent news has led me to dust off this work.
The goal here is twofold:
To learn from the good, bad, and ugly of ‘21
To point towards the potential of NFTs in ‘24 and beyond
There will be a total of four chapters that I will release over this week. This post covers chapter 2, chapter 1 should be read first which you can find below:
Users & Scale: ~650K users spent $6.5B on NFT mints
Trapped in a Casino: The majority of users & funds never leave crypto
Mausoleum for a Burned Ape: IP narratives dominated with glimmers of hope for Art
Against the Mainstream: A new path for “NFTs” in ‘24 and beyond
Chapter 2: Trapped in a Casino
Or put more nicely: crypto is a culture and way of life

When the market is “bearish,” there is a belief that everyone has left. There’s less activity. The number isn’t going up. Things aren’t WAGMI anymore.
The reality is quite different. A vast majority of the heaviest users of crypto remain. And those heavy users hold a majority of the actual spending power. Now they may go “dormant” or transact less often, but the data would say they rarely “quit.”
To see this, we will start with a simple user segmentation to understand who the most valuable wallets in the ‘21-’23 cycle really were.
We placed every ETH wallet into a bucket based on how much secondary NFT volume they spent in 2021 and 2022.
The NFT “users” we identified in Chapter One map quite well to higher activity (>2 ETH spend) wallets. Additionally, we start to get the early shape of a segmentation curve.
For those less familiar with segmentation, we will now use these “buckets” of wallets to track their behavior in different ways.
Let’s go a bit deeper now and look at the actual total spend on secondary markets across these different segments. For ease of charting, we will only look at wallets with spend >0.1 ETH.
You can see that roughly ~600K wallets (those that spent >=2.0ETH on secondary) drove 95% of the total NFT volume over this time period. This lines up well with our earlier “guesstimate” on users.
Additionally, something else a bit more surprising appears… The top 6% of wallets account for 76% of all NFT volume over this time.
Just for fun… let’s double click into the wallets in that red box.
Probably nothing surprising here… There are some serious whales who spend huge amounts of NFTs. Recall that this is mostly at a time where washtrading had minimal incentives and the obvious washtrading is easy to filter out.
Before we go further, let’s dwell on this key insight. It’s nothing shocking, but it’s important:
Effectively all of the NFT volume is driven by heavy users. This is not surprising or unique to NFTs as we will cover later, but it is important to remember this. The “mainstream” consumer that is often being chased after who will “buy your bags” will never have anywhere near this spending power. The idea of the mainstream consumer who appears during the bull market is merely a signal for the heaviest, wealthiest crypto natives to double down on their commitment. This is not a flaw, this is part of the resilience of crypto to continue to resurrect and reappear when you least expect it.
What we are seeing above is actually typical of the statistical distribution of users in systems like crypto… It’s often called the Pareto principle.
From Wikipedia:
Mathematically, the 80/20 rule is roughly described by a power law distribution (also known as a Pareto distribution) for a particular set of parameters. Many natural phenomena distribute according to power law statistics.[4] It is an adage of business management that "80% of sales come from 20% of clients."
Essentially, many systems with “consumers” end up in a power law distribution. It’s often talked about as “80 / 20” per the above.
NFTs are no different. See below for a table version of the data for my nerds out there… This time we look only at the wallets that have spent >2 ETH (or the top ~600K wallets)
Surprise, ~20% of wallets do 80% of the volume. Now here’s what’s surprising… this is in a huge market, worth billions of dollars. And these are individual collectible goods.
What’s startling here is that there is such an immense concentration of wealth to enable a relatively small number of wallets to be able to drive so much volume. And it’s not simply washtrading or manipulation.
The more you dig into these wallets the more you find some of the familiar faces from CT as well as some holders who seem to just be happily sitting on their Apes, Penguins, Yetis, Fidenzas, Rug Radio Tokens, and more.
So we identified the relative scale and size of the largest spenders and their import... Let's put this in context now. When we talk about adoption, when we talk about toy sales, IP deals, brand deals, Jimmy Fallon talking about Apes, and so on...
There is an assumption that ADOPTION has driven the volume. Or more naively, that ADOPTION IS driving volume. While it has the potential to drive some volume (10M users spending 0.05ETH = ~$12B volume), it has had minimal direct impact on the current state of affairs.
This is important since the primary price thesis was based in a narrative of "new money" coming in from presumably "new users." This isn't what's happening. Existing users and "early adopters" who are deeper into the system simply gain conviction in spending more.
When I say Trapped in the Casino, I’m pointing towards something uniquely interesting and potent about crypto. While the implication so far has been negative, there’s actually something secretly powerful about the foundational dynamics in crypto that make it also a potent area for unique experiments.
Let’s take a look at what happened AFTER the NFT bubble popped… What happened with these users… Did they quit? Or just go dormant?
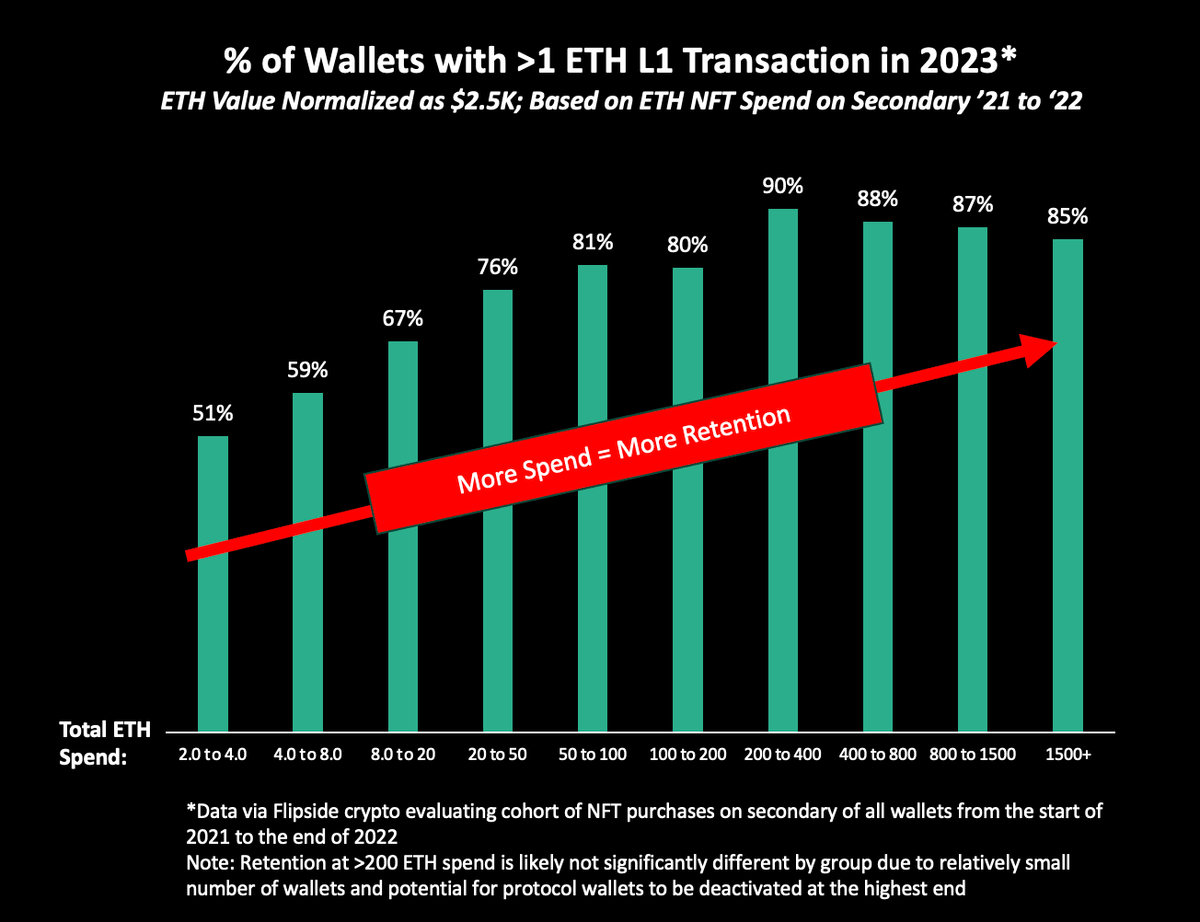
We look at our same segments (NFT volume based on ‘21-’22)… but this time look at whether or not they did anything on ETH in H1 of 2023.
The relationship of spend to “retention” is not surprising fundamentally. For a variety of reasons, this is a common pattern: the more you participate in something the more likely you are to continue to participate. What is surprising, however, is that this retention is so strong over a period of time where people felt the market was “dead.”
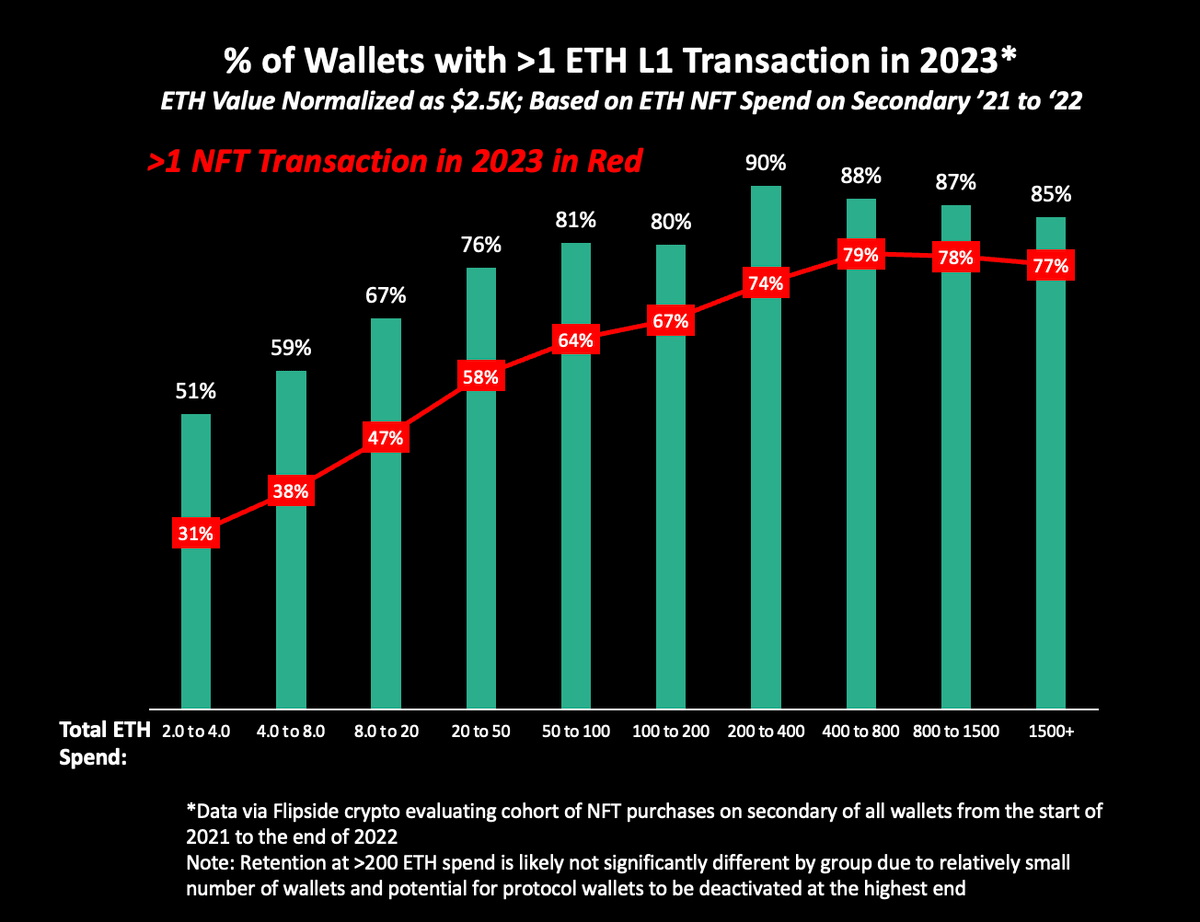
Let’s take a look at just NFT transactions… just to be a little bit balanced.
It’s still very strong.
Let me frame this again… Those heavy spenders, people who spent millions on NFTs, just stayed in crypto. They didn’t cash out and go to the beach. They didn’t run away because they lost everything. They didn’t leave crypto because their bags were down (in 2023) potentially -90%. They are still here.
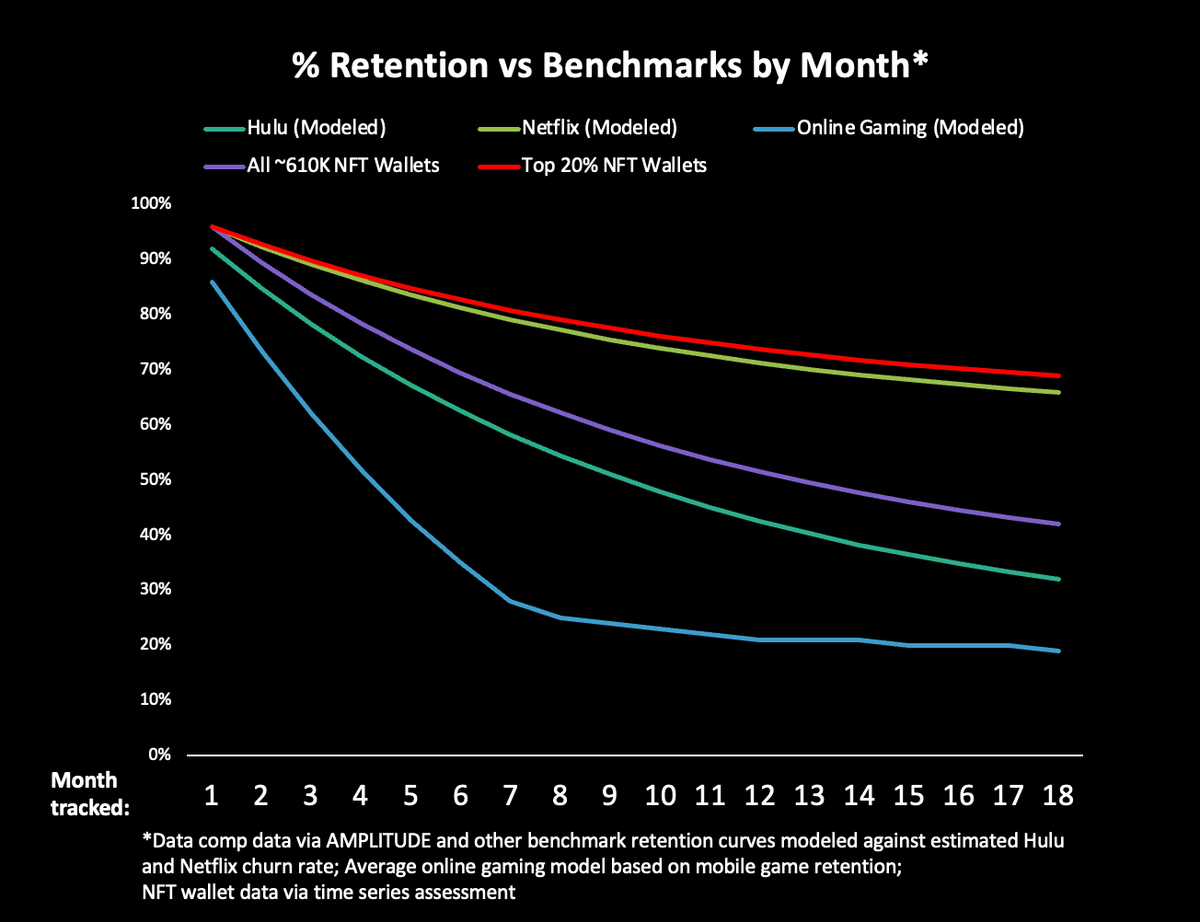
And if you don’t think this is surprising, let’s compare to the adoption curve of almost any other subscription model which has… a very very low cost of participation.
Netflix retention beats out the ~600K NFT wallets. Okay sure. Mind you Netflix has one of the best retention rates of any system or model.
But… Top 20% of NFT wallets (who spent… literally $40B)… they beat Netflix.
You have people who literally have the ability to trade $40B in two years with the same level of addiction to crypto as the average American has to Netflix.
This is what I mean by “Trapped in the Casino.” Now, I originally intended to do an analysis looking at gambling and mobile gaming behaviors in comparison to crypto. There are a lot of similarities. I’ll share this one quote from an excellent book on online poker:

Natasha Dow Schull is worth reading for anyone looking to get a better understanding of how gambling and addiction function. There are lots of mechanisms in crypto that play on this urge, but I think it’s important to zoom out as well…
This isn’t just a game. It’s not just Apes. It’s not just an IP deal. It’s not just posters on your wall.
It’s a world where participation in a digital culture is all encompassing. It’s a world where your ability to be social (transact) is reliant on your presence and liquidity.
For all of the talk of human greed in crypto, the people who should “make off like bandits” sure do seem to stay here forever.
Think about those who “rugged” for millions, think about the 50% of NFT project funds that went back into NFTs, think about your own experience. We want to stay here and not “just” for the money.
In closing, some key points:
Cryptonatives and early adopters drove the NFT market
New entrants have value but primarily as “excitement” drivers for existing users to double down
Participation is sticky, the more you play the more you stay
In the next chapter, we will take a deep dive into the actual projects of the ‘21-’23 cycle. While I am ending this chapter on a slightly positive note… get ready because you are in for a nightmare remembering the best and the worst of the ‘21-’23 cycle. See below:


